Table 1 Results for Testing using QMR Reactive Ground Test and the AEISG Code of Practice


Appendix 1 – Temperature Graphs
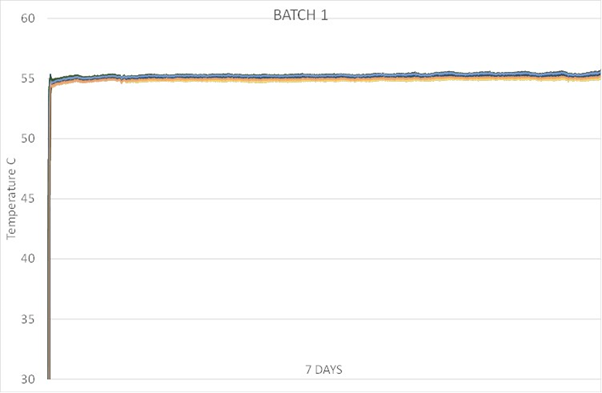
Figure 1-Temperature graph of first 52 samples.

Figure 2 – Temperature graph of last 52 samples

Figure 3 – Temperature graph for 2 samples that contained 2.46% and >10% reactive sulphide (A reaction was inhibited by coal contained in both samples)
APPENDIX 2 – SMALL TEMPERATURE ISOTHERM ON HEATING

Figure 4 - Temperature Graph of sample 5097-RG-006 showing small isotherm on heating

Figure 5 - Temperature Graph of sample 5097-RG-006 retest showing a smaller isotherm on heating
QMR Reactive Ground Test

Figure 6 - Bubbling of solution of sample 5097-RG-006 indicating carbonates.

Figure 7 - Sample 5097-RG-006 under QMR Reactive Ground Test

Figure 8 - Screen dump of QMR Reactive Ground Test Program sample 5097-RG-006 test showing a rise in temperature due to a reaction with sulphide and nitrates

Figure 9 - QMR Reactive Ground Test Result File for sample 5097-RG-006
Testing as per the AEISG Code of Practice

Figure 10 – Sample 5097-RG-006 mixed with ammonium nitrate and acidic weathering agent and tested a pH of 4 before being placed in the reaction tube.

Figure 11 - Sample 5097-RG-006 mixture just placed in oil bath at 55°C.

Figure 12 - Sample 5097-RG-006 mixture had a pH of 7 after AEISG test due to carbonates.